
A Fortune Business Insights report estimated that the market for data visualization in 2021 would be $9.85 billion. The market value will reach $19.20 billion by 2027 at a 10.2% compound annual growth rate. Global data visualization is being driven by the proliferation of smartphones, increasing Internet use, rapid advances in Machine Learning, and rising adoption of cloud computing technologies. The data visualization market is also growing due to the increasing demand for smart factories, increased use of visual analytics, scientific visualization in small and large organizations, and the increasing desire for intelligent factories. For performing such tasks there are various data visualization tools are available over internet, in this article we will discuss some of the best and top data visualization tools that are worth each penny.
What is Data Visualization?
Data visualization refers to the art of translating data into visual contexts, such as maps or graphs, to make it easier for the brain to comprehend and extract insights. Data visualization’s main purpose is to help you identify patterns, trends, and outliers within large data sets.
Data visualization is a great career. However, there aren’t many jobs that allow you to create reports from data. This is because it’s not a specific field. However, this skill is great and most commonly used in data jobs. To add real value to a company, you will need to be proficient in data analysis and front-end programming.
PROS. Better understanding. Facilitate information sharing. Accurate analysis. Analyze sales. Find relations between events—modification of data.
CONS. It provides estimation, not accuracy. Biased. Ineffective assistance. Improper design issue. People who are not focused can miss the core message.
These 14 data visualization tools are top-notch and are quickly gaining market recognition due to their outstanding performance and ease of use.
1. Tableau

Tableau is a Data Visualisation Tool that can create interactive graphs and charts. It is also widely used for Business Intelligence, but it is not limited to that purpose. You can create interactive charts and graphs in the form of worksheets or dashboards. This will help you gain business insight. Drag and drop are all that’s required to make this happen.
2. Dundas BI
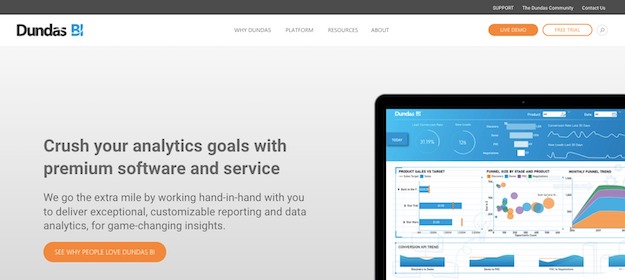
Dundas BI, which is web-based, provides simple-to-use tools for creating ad-hoc reports to allow you to drill down into your data quickly. In addition, Dundas BI’s ad hoc reporting tool allows you to create reports quickly and display information that is not part of your regular BI reporting.
3. JupyteR
Jupyter Notebooks offer a data visualization framework called “Quiz” that allows you to visualize dataframes using improved charting options and Python plots via the Spark driver.
Data scientists use Jupyter notebook to carry out their daily data analysis tasks. The notebook is often the first tool an analyst learns about in a course on data science.
4. Zoho Reports
Zoho Analytics is a data visualization tool that transforms any data into rich visuals. It helps you make better decisions and arrive at them faster.
5. Google Charts
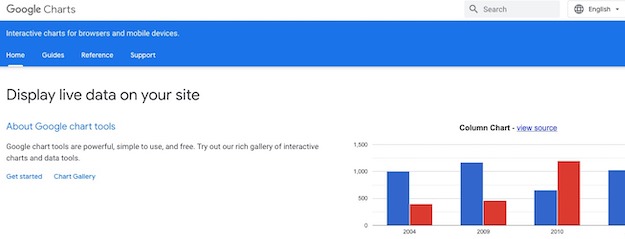
Google Charts is a great way to visualize data from your website. Charts are rendered using HTML5/SVG technology to provide cross-browser compatibility (including VML in older IE versions) and cross-platform portability to iPhones and Android; charts are rendered with HTML5/SVG technology.
6. Visual.ly
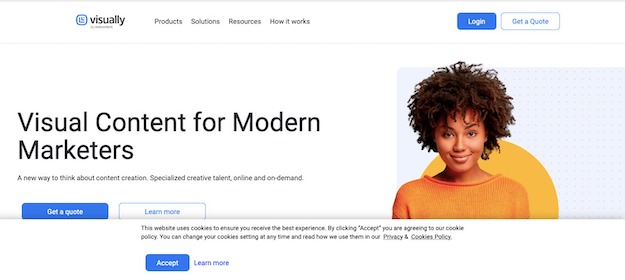
Visual.ly is a data visualization tool that is widely used. Its impressive distribution network illustrates the project results. In addition, Visual.ly has a dedicated team of creative professionals specializing in data visualization services. This makes importing and exporting data easier, even to third parties.
7. RAWGraphs
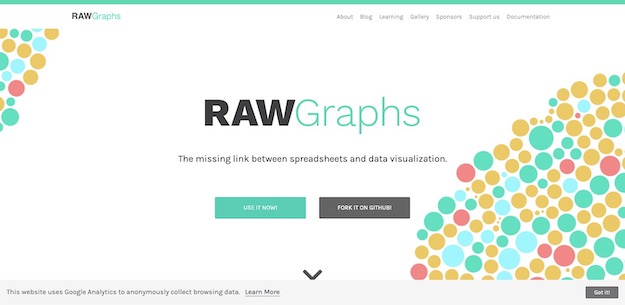
RAWGraphs, an open-source data visualization framework, was created to simplify the visual representation of complex data. Visualizations can be edited using vector graphics software for further refinement or embedded directly into web pages.
8. IBM Watson
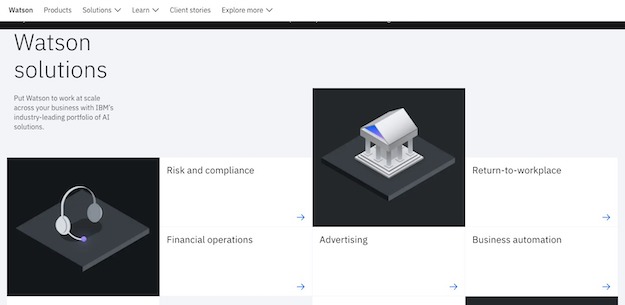
This is high-quality data visualization tool, named after IBM founder Thomas J. Watson uses analytic components and artificial intelligence to identify patterns and insights from structured and unstructured data. IBM Watson’s self-service visualization tool, which leverages NLP (Natural Language Processing), guides users through every step of the insight discovery process.
9. Sisense
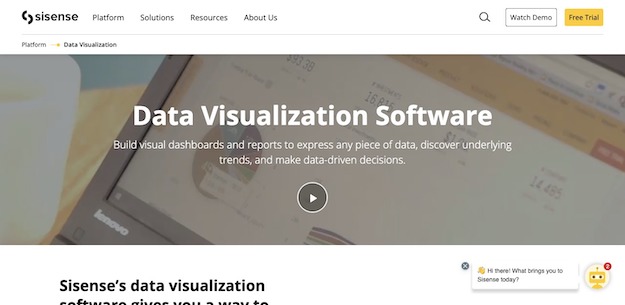
Sisense, the only Big Data analytics, and visualization tool, empower analysts and business users to analyze and prepare terabyte-scale data, from multiple sources, without any additional software or technology.
10. Plotly
Plotly, an open-source data visualization tool that creates interactive graphs and charts of publication-quality quality, is called Plotly. Plotly allows you to implement many graph types/objects such as line plot, scatterplot, area plot, and histogram.
11. Data Wrapper
Datawrapper can visualize data for small businesses that have only basic back-end data. Therefore, it does not integrate with existing services. Instead, it accepts data copied and pasted into the service or imported through a CSV/XLS.
After your data is added to the platform, you can quickly create highly visual renderings. Datawrapper’s strength is its ability to create visually appealing visualizations. This makes it a valuable tool for B2C companies who wish to share their data with customers.
12. Fusioncharts
FusionCharts Suite lets you create your chart in any way you like – visual or functional. Our events and API allow you to configure your charts using attributes, add layers via annotations, or create complex visualizations.
13. Power BI
Microsoft Power BI allows you to connect to your data quickly, prepare it and model it however you wish. This tool lets you embed custom visualizations in your website or app, and connect to hundreds of data sources such as excel, google analytics, and IoT devices to get real-time data.
14. QlikView
Qlik’s visualization tool is simple and allows users to take complete control of their business. This tool allows you to consolidate, search and visualize all data sources to find useful business insights.
Conclusion
Many data visualization tools are available, and at least one for every business.
The result is what your team will use for business decisions. First, however, there is a crucial piece of the puzzle: getting customer data into your data warehouse and modeling it. Then, push it out to your preferred data visualization tool.
