PHP, one of the most widely used scripting languages for web development, has revolutionized the way we build dynamic and interactive websites. However, as with any programming language, debugging is an inevitable part of the development process. Fortunately, there is a plethora of powerful PHP debugging tools available that can help developers identify and resolve issues quickly and effectively. In this article, we will explore the best PHP debugging tools that can significantly streamline your development workflow and enhance the performance of your PHP applications.
Why to Use PHP Debugging Tools
Using PHP debugging tools is essential for ensuring the reliability, efficiency, and quality of your web applications. These tools provide developers with a systematic approach to identifying and resolving coding errors, logic flaws, and performance bottlenecks. By utilizing debugging tools, you can:
Save Time and Effort: Debugging tools streamline the process of finding and fixing issues, reducing the time spent on manual troubleshooting and increasing development efficiency.
Enhance Code Quality: Debugging tools help catch and rectify errors before they reach production, resulting in more stable and secure applications.
Optimize Performance: These tools offer insights into resource usage, database queries, and execution flow, enabling you to optimize your code for better performance.
Understand Code Behavior: Debugging tools allow you to step through code, inspect variables, and trace program execution, providing a deeper understanding of how your code works.
Collaborate Effectively: Debugging tools facilitate collaboration among team members by providing clear insights into code issues and enabling efficient communication.
Incorporating PHP debugging tools into your development workflow empowers you to create robust, efficient, and error-free applications, delivering a superior experience to users while saving valuable time and resources.
Here is the list of Best PHP Debugging tools you should use to optimize your code for flawless experience.
1. Xdebug: Supercharge Your Debugging
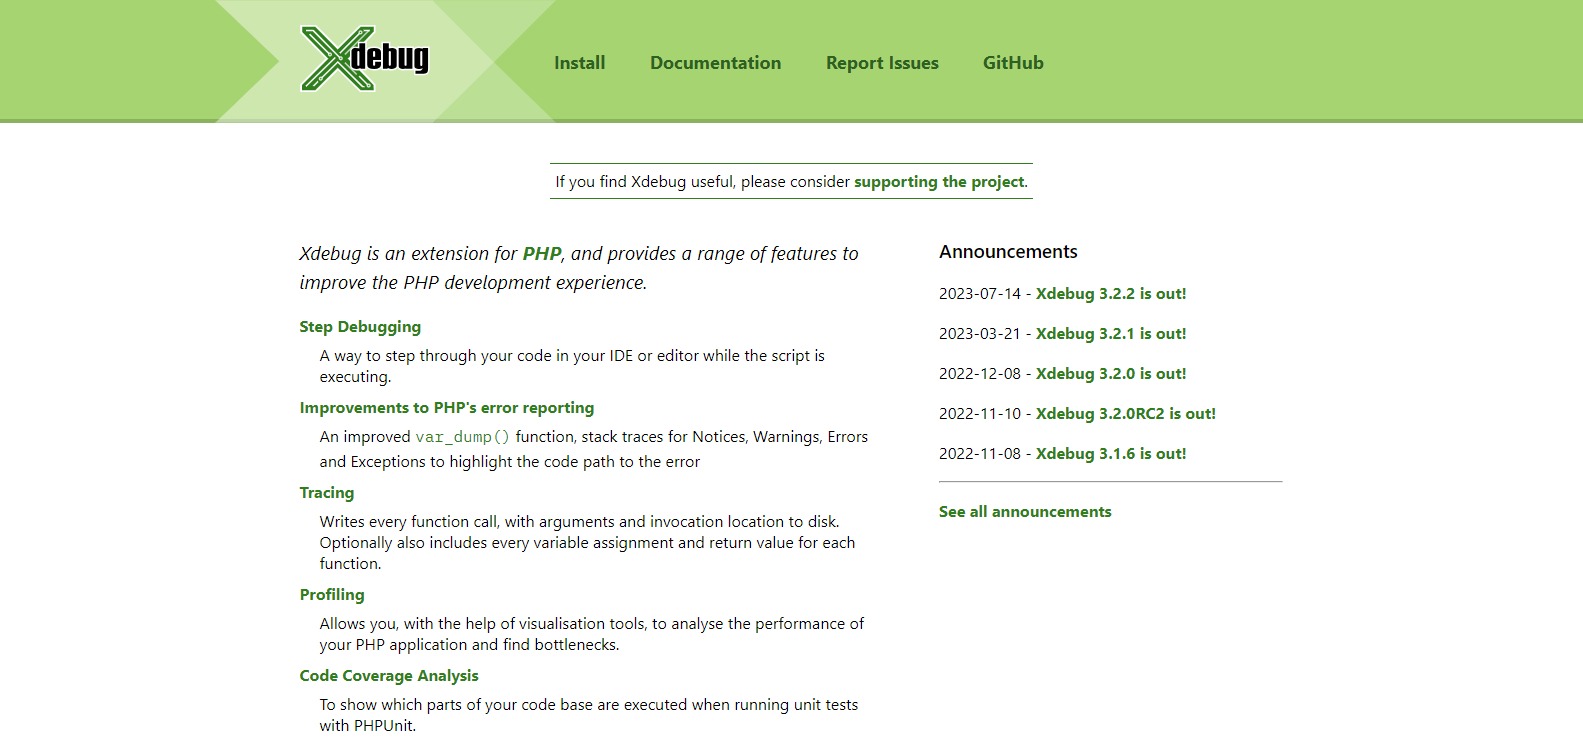
Xdebug is a renowned PHP debugging extension that provides an array of features to assist developers in debugging their code. It offers seamless integration with IDEs, stack traces, profiling information, and remote debugging capabilities. With Xdebug, developers can set breakpoints, step through code, inspect variables, and even analyze code coverage. Its compatibility with popular IDEs like PhpStorm and Visual Studio Code makes it an indispensable tool for any PHP developer.
2. PHPStorm: Integrated Development and Debugging

PHPStorm, a robust PHP IDE, comes equipped with an array of debugging tools that make code troubleshooting a breeze. It offers tight integration with Xdebug and facilitates easy debugging setup. Developers can debug their PHP applications directly within the IDE, inspect variables, evaluate expressions, and gain deep insights into their code’s execution flow. Additionally, PHPStorm’s comprehensive feature set, including intelligent code completion and version control integration, enhances the overall development experience.
3. Zend Studio Debugger: Fine-Tuned Debugging
Zend Studio Debugger is another powerful tool that provides advanced debugging capabilities for PHP applications. With its remote debugging support, developers can identify and fix issues on live servers without disrupting the user experience. It offers detailed stack traces, variable inspection, and profiling options, enabling developers to optimize code performance. Zend Debugger’s ability to handle large-scale applications and its compatibility with various IDEs make it a valuable asset for complex PHP projects.
4. Tracy: Debugging with Style

Tracy is a user-friendly debugging and profiling library that adds a touch of style to the debugging process. It offers detailed error and exception reporting, customizable log messages, and interactive debugging panels. Tracy’s appealing user interface makes it easy to visualize debugging information, helping developers quickly pinpoint issues in their code. Its integration with popular frameworks like Laravel and Nette further enhances its usability.
5. Kint: Visualizing Debugging Data
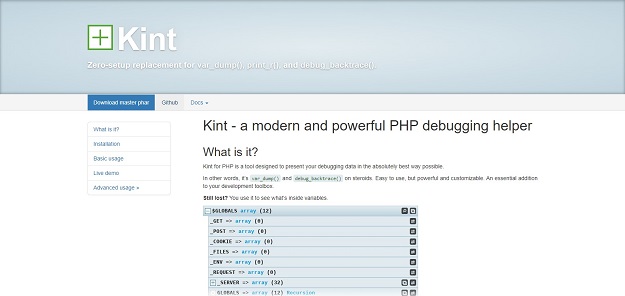
Kint is a debugging tool that focuses on visualizing complex data structures and variables. It simplifies the process of inspecting arrays, objects, and other data types by presenting them in an easily understandable format. Kint’s colorful and interactive output makes it a valuable asset for developers seeking to visualize and analyze complex data during the debugging process.
6. PHP Debug Bar
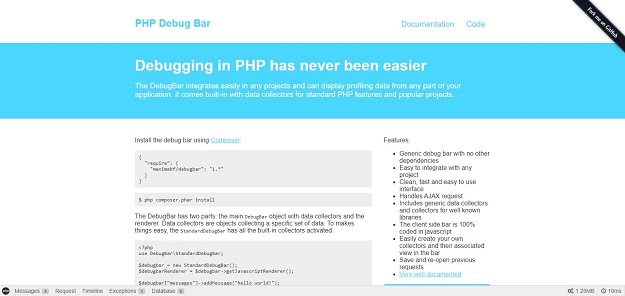
DebugBar is a free and open source app that can integrate into any PHP project and collect + present profiling data. It has no dependencies, supports Ajax requests and includes generic data collectors and collectors for well known libraries.
7. Krumo
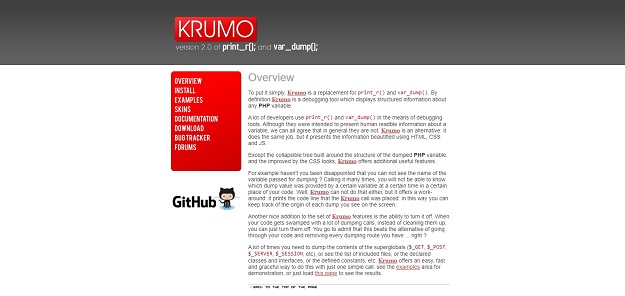
To put it simply, Krumo is a replacement for print_r() and var_dump(). By definition Krumo is a debugging tool, which displays structured information about any PHP variable. It does the same job, but it presents the information beautified using HTML, CSS and JS. Another nice addition to the set of Krumo features is the ability to turn it off. When your code gets swamped with a lot of dumping calls, instead of cleaning them up, you can just turn them off.
8. Pinba
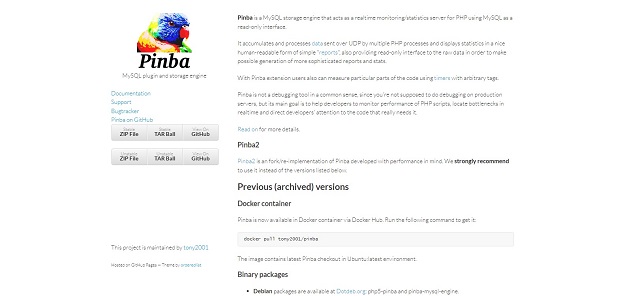
Pinba is a MySQL storage engine that acts as a realtime monitoring/statistics server for PHP using MySQL as a read-only interface. It accumulates and processes data sent over UDP by multiple PHP processes and displays statistics in a nice human-readable form of simple “reports”, also providing read-only interface to the raw data in order to make possible generation of more sophisticated reports and stats. With Pinba extension users also can measure particular parts of the code using timers with arbitrary tags.
Pinba is not a debugging tool in a common sense, since you’re not supposed to do debugging on production servers, but its main goal is to help developers to monitor performance of PHP scripts, locate bottlenecks in realtime and direct developers’ attention to the code that really needs it.
9. MacGDBp
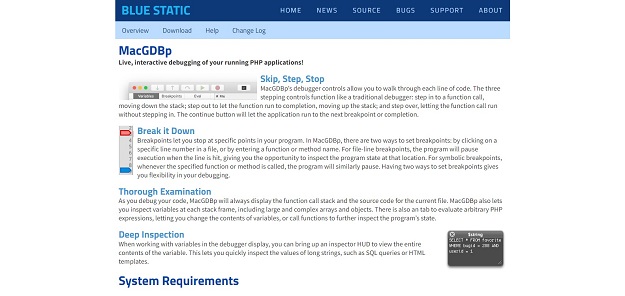
MacGDBp’s debugger controls allow you to walk through each line of code. The three stepping controls function like a traditional debugger: step in to a function call, moving down the stack; step out to let the function run to completion, moving up the stack; and step over, letting the function call run without stepping in. The continue button will let the application run to the next breakpoint or completion.
Conclusion
Effective debugging is a crucial skill for any PHP developer, and the right set of tools can make a significant difference in the efficiency and quality of your code. The PHP debugging tools mentioned in this article offer a range of features that cater to different debugging and profiling needs. Whether you’re seeking in-depth insights into code execution, performance optimization, or real-time debugging, these tools provide the means to identify and resolve issues promptly, ultimately leading to more robust and high-performing PHP applications. By incorporating these debugging tools into your workflow, you can streamline your development process and deliver exceptional web experiences to your users.